Key figures in production: OEE as the key indicator
The OEE is the most important key figure in production and therefore a key indicator.
If data is recorded on the store floor and systematically condensed into key figures – ideally automatically with a Manufacturing Execution System (MES) – companies gain valuable insights. Used correctly, KPIs help to continuously improve production performance. Among the key performance indicators (KPIs), Overall Equipment Effectiveness (OEE), which was developed in the 1980s at the Japan Institute for Plant Maintenance (JIPM), occupies a special position. This is because OEE brings together all the factors that determine the performance of machines and systems – or even production lines: availability, performance and quality. This makes it possible to understand how well equipment is utilizing its potential and where losses occur.
Availability: When does a machine produce?
Availability indicates the ratio between the possible and actual running time of a machine:

Availability is an important part of OEE and indicates the ratio between the possible and actual runtime of a machine.
In order to calculate the availability for the OEE, the possible production time must first be defined. This is because a machine is only very theoretically available for production 24 hours a day; downtime is always planned. Not all companies work in three shifts including weekends, but possibly only 16 hours on five days. Machines and systems also need to be serviced regularly.
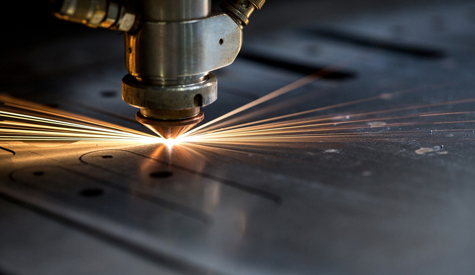
Example: A company works two eight-hour shifts a day, with two hours scheduled for the maintenance of a CNC milling machine during this time. The machine could therefore theoretically run for 14 hours. In reality, however, it only runs for 12 hours. Availability is therefore around 86 percent.

The availability of a machine can be calculated using the production time. It is therefore the basis for the OEE.
This raises the question for the company as to why the machine was unable to produce for two hours and where this loss of availability came from. There are three typical causes for such an unplanned downtime:
- A fault has occurred on the machine itself.
- Maintenance took longer than originally planned.
- There was a lack of orders, material and/or employees to continue production.
The more detailed companies record the reasons for a standstill – combined with its duration – the more meaningful conclusions can be drawn and the more targeted improvement measures can be introduced.
WEBINAR
Establishing transparent production processes
Find out how you can bring more transparency to your production and uncover optimization potential.
Register for the webinar now
Performance: How fast does a machine produce?
Even if a machine is running – i.e. is basically available – it can produce at different speeds. And this has a direct impact on the number of units produced and therefore the OEE. The performance of a machine is therefore determined by the ratio of possible to actual output:

The output of a machine is calculated based on the ratio of the actual to the possible output.
Before the calculation can be made, a definition must first be made. The companies must determine how much time the production of a certain product quantity should ideally take. This is challenging because manufacturers often provide information about the performance of their machines and systems. However, as the products to be manufactured vary greatly, these general estimates can only be approximate values. A pragmatic approach is to use the measured actual values to define and continuously adjust the target value. The target value should therefore be the best measured actual value for a particular piece.
Example: The company has found out from recorded data that it takes one minute at best to machine a metal cladding on the CNC milling machine. This means that 60 pieces could be produced per hour. However, only 45 pieces are actually milled. The output is therefore exactly 75 percent.

Exemplary calculation of the power of a machine.
- During production, the machine repeatedly experienced minor malfunctions.
- The machine did not run at the highest speed.
In addition, deviations in performance – positive or negative – are often important indicators of incorrect, i.e. too low or too high, target values. As described above, these must be set realistically and adjusted regularly if necessary.
Quality: How well does a machine produce?
Every work step along a production line should result in products that can be further processed and ultimately sold. In this respect, it is not only important how many pieces a machine produces, but also how many of them can be directly reused. The ratio of these two values indicates the quality, which is also a key factor in OEE:

Quality is a key factor in OEE and is calculated using the ratio of flawless pieces to actual output.
As two measured values are related in this case, there is no need for companies to define them in advance.
Example: Of the 45 metal claddings produced, two are rejects and therefore cannot be used at all. Three claddings must at least be reworked. This means that 40 of the 45 pieces are flawless. This corresponds to a quality of around 89 percent.

Exemplary calculation of the quality of a machine.
The possible causes of faulty pieces are manifold – from defects in materials and preliminary products to negligence on the part of employees on the shop floor and defects in the machine or system. In order to identify structural problems, the reasons for quality losses should therefore be documented and compared with other reasons: for example, the absolute number of faulty pieces per cause type, the frequency of cause types per product or per shift.
Availability x performance x quality = OEE
The multiplication of the previously calculated values results in the OEE as a KPI:

OEE is the product of availability, performance and quality.
The company in the example would therefore achieve an OEE figure of around 57 percent for its milling machines:

This is how the OEE is calculated from our example.
In principle, the OEE key figure is suitable for comparison. However, if the absolute values are compared, great care must be taken to ensure that comparable items are actually being compared. This is the case, for example, when the overall equipment effectiveness of a machine is considered over time. Identical production technologies within a department can also be compared – provided that parameters such as product and batch size mix match. A purely quantitative OEE comparison of different departments or even locations, on the other hand, is critical.

Once the OEE has been calculated, its evaluation provides many useful results.
This is critical because what is a good and what is a bad OEE value depends entirely on the specific situation on the store floor and the framework conditions. For example, a company could achieve an OEE of 80 percent at one production site and 90 percent at another. A closer look is needed to assess this correctly. Both sites produce the same metal cladding. However, the 80 percent plant manufactures in smaller batch sizes because the market demands it. Numerous measures have already been taken here over the years and everything has been exhausted. 80 percent is therefore excellent. The market does not limit production at the 90 percent plant. 90 percent is not the optimum, there is still room for improvement.
The aim should always be to use OEE to identify and eliminate the causes of losses. It is important to always keep in mind that the three individual values are not only mathematically but also factually linked. Measures aimed at optimizing one value may have a negative impact on another. What takes precedence in the event of conflicting objectives ultimately depends on the company’s specific situation and strategy.
You might also be interested in…
E-book: How to make your processes fit for digitalization

Digitalization makes company processes more efficient. However, this only applies if the processes are already running smoothly beforehand. In the e-book “Digitize processes – and optimize them in the process”, you can read how to put your existing processes to the test and improve them.
![]()


