Data is the foundation for informed decisions—provided it is presented clearly and tailored to the target audience. This is exactly where our MES Dashboard Designer for SAP comes in. With this tool, you can create custom dashboards not only for top MES in SAP Fiori—flexibly, intuitively, and even without programming knowledge ( no-code)—and achieve impressive results right away. Depending on the complexity of the requirements, you can scale up to low-code and pro-code solutions to achieve virtually any desired outcome.
Standard reports are often predefined. Their structure, layout, and presentation can only be modified to a limited extent. As a result, different users are forced to work with the same information—even though their needs are often completely different. Senior management tends to focus on overarching metrics such as OEE and productivity. Operational management needs a machine dashboard that provides an up-to-date overview of the shop floor, machine status, and production progress. For the production worker, on the other hand, the focus is on individual machines, including target versus actual progress, running and downtime, and production quantities.
With the SAP Dashboard Designer for top MES User interfaces and reports can be customized to suit each target group and tailored to individual needs. This ensures that every user receives exactly the information they need for their daily work.
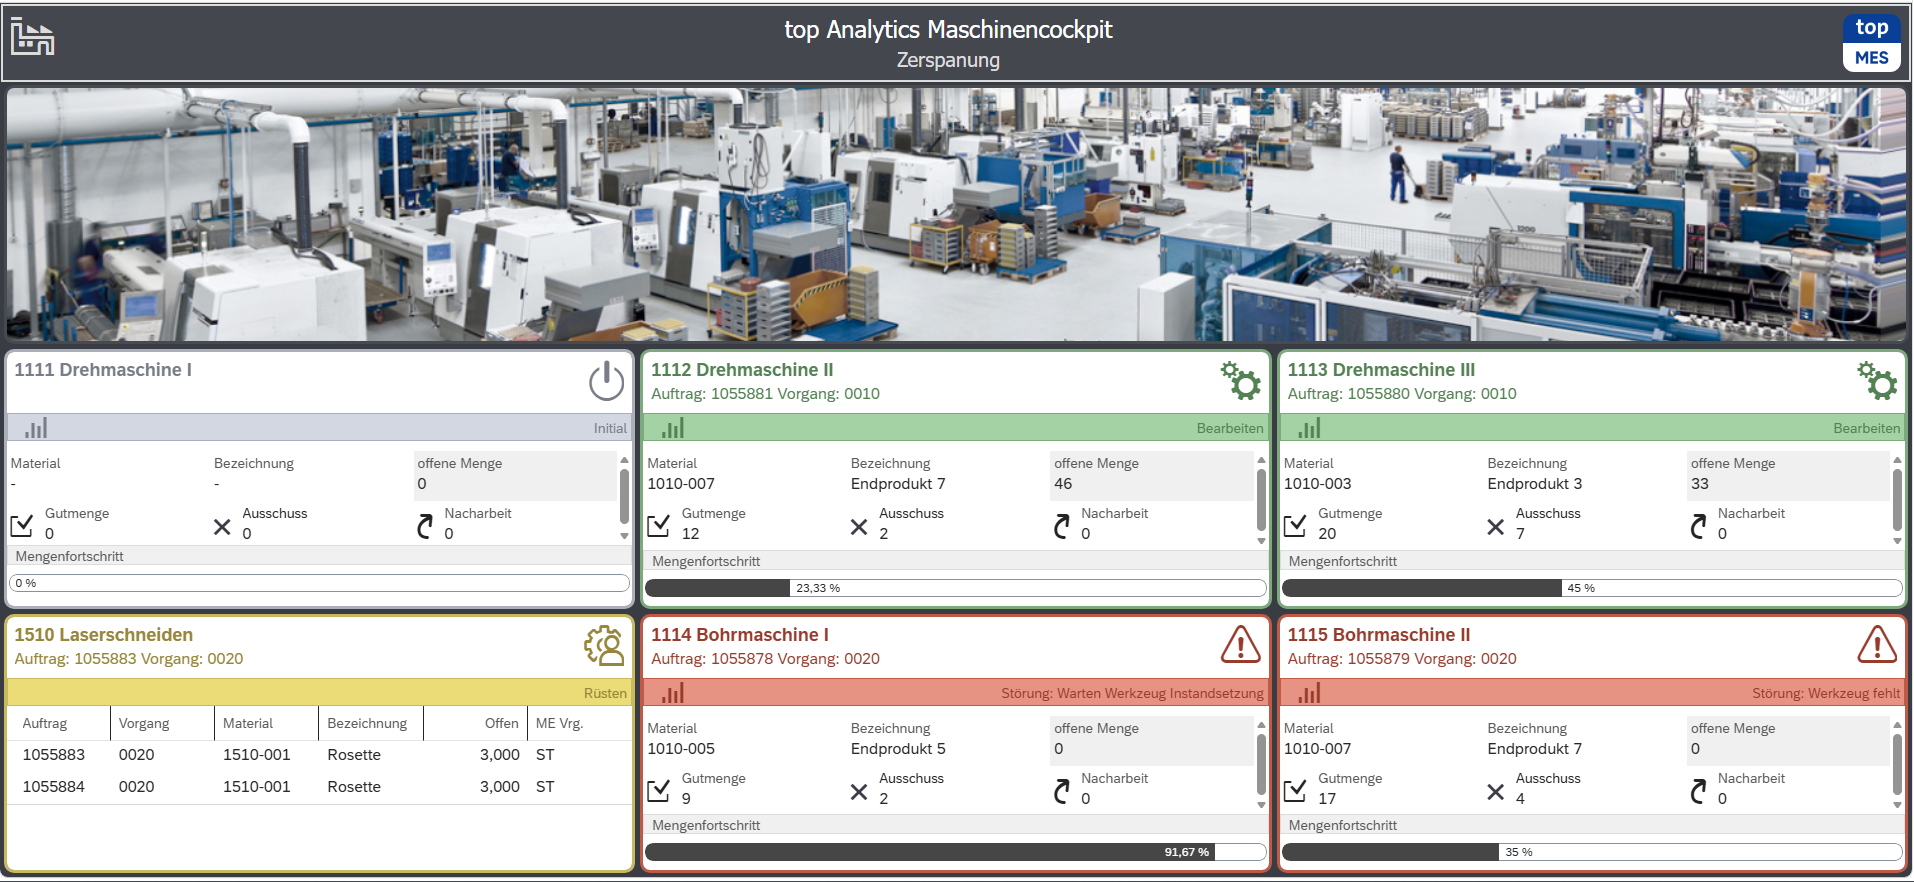
The MES Dashboard Designer for SAP provides numerous predefined objects and widgets that can be used to visualize production metrics such as good yields, quantities produced, scrap, run times, downtime, and labor hours.
The desired elements are simply placed on the dashboard using drag-and-drop and then customized. Parameters can be adjusted, or you can define your own settings.
Various chart types are available for visualization, such as bar charts, column charts, line charts, and pie charts. In addition, colors, headings, borders, line weights, and other design elements can be flexibly customized.
Ready-made sample analyses are available to help you get started quickly. These can be used as a basis for your own dashboards and customized as needed. Alternatively, you can build a dashboard from scratch.
In addition to traditional charts, the Dashboard Designer offers numerous options for creating interactive user interfaces.
For example:
This results in modern SAP dashboards that not only display data but also actively support analysis and decision-making.
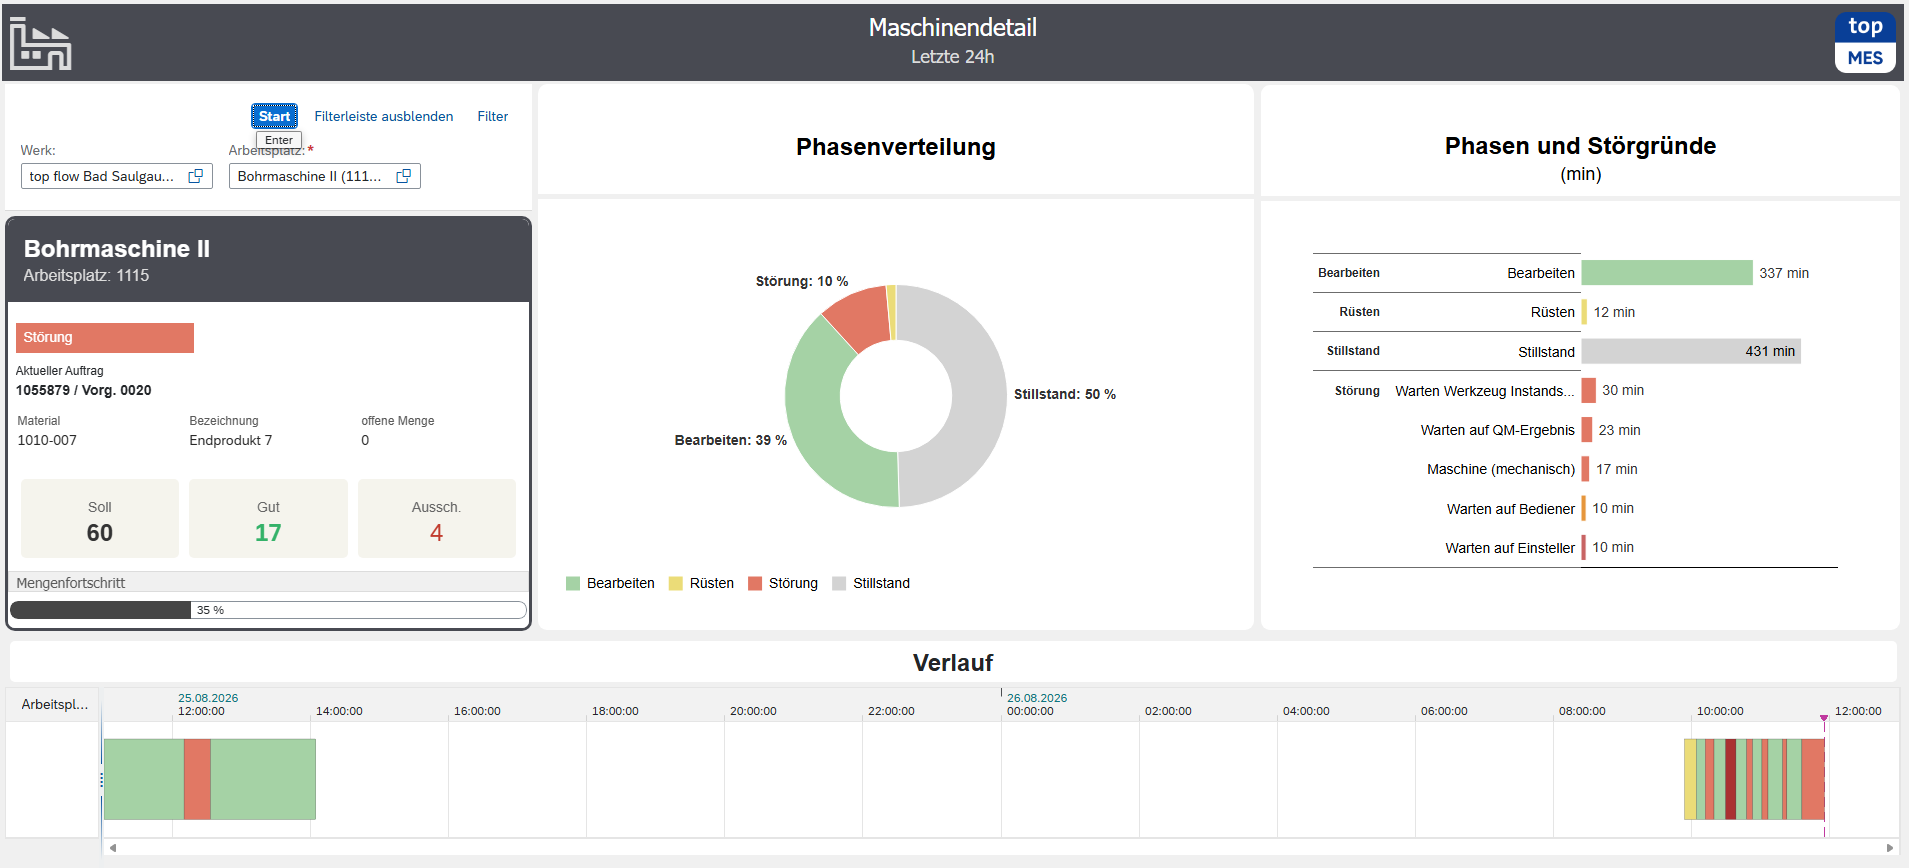
The data for the dashboards comes directly from SAP and the top-MES solution, and is provided directly from the SAP backend via an OData interface (Open Data Protocol).
This allows production metrics to be visualized right where they are generated—without the need for an additional BI solution or complex interfaces.
Custom requirements can also be accommodated. If specific metrics are defined individually, they can be integrated using custom CDS views and then displayed in the dashboard.
With the MES Dashboard Designer for SAP, you can create exactly the reports your users need—flexible, customized, and based directly on your SAP data.

top flow GmbH


